
Built to Automate & Scale Your Operations
Answer a couple of questions and we'll connect you with the right team member.
Answer a couple of questions and we'll connect you with the right team member.


Higher Occupancy Associated with Centralization
Potential Incremental Annual Rental Revenue Per Property
Properties Analyzed
Centralized properties are associated with a 1.2 percentage point occupancy advantage over local ALN Apartment Data market benchmarks among EliseAI’s active communities, after controlling for market conditions, asset class, geography, and seasonality. This analysis uses monthly 2025 property-level occupancy data from ALN to compare performance between centralized and non-centralized properties within a stabilized EliseAI portfolio.

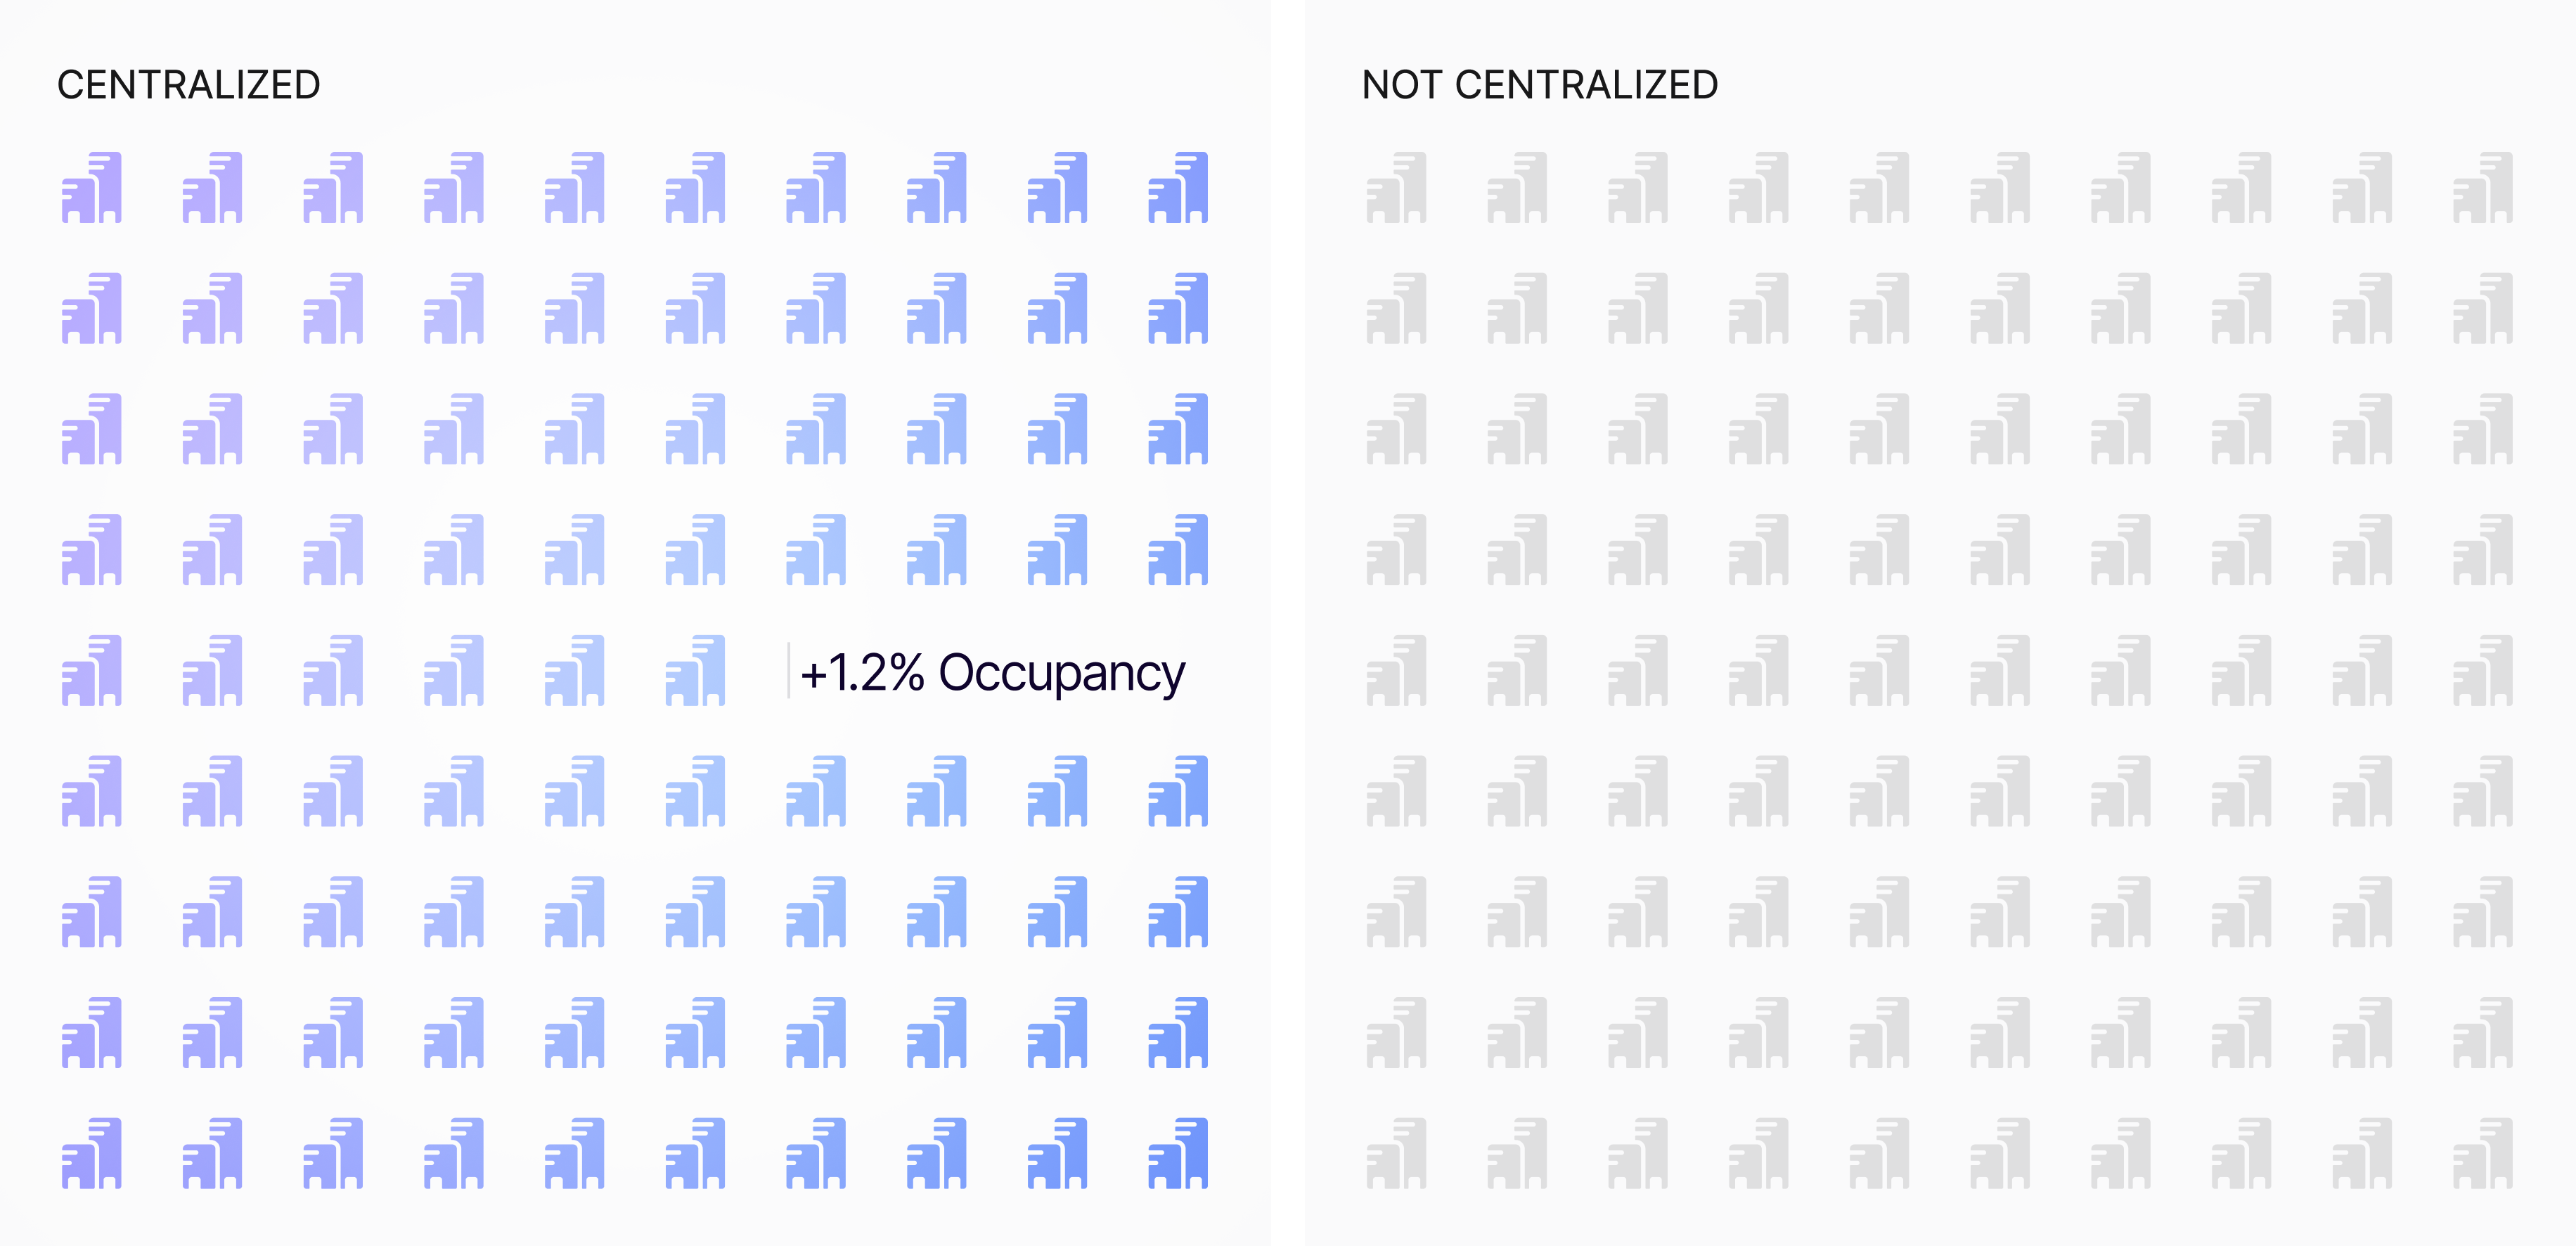
Centralized properties are associated with approximately +1.2 percentage point higher occupancy rates than non-centralized peers after controlling for market, asset class, and geography.
The study analyzes a stabilized 2025 panel of 775 properties (230,000+ units) across 32 operators ranging from 3k to 100k+ units and spanning 35 states.
Centralization status was validated through a combination of qualitative review and internal product usage data, ensuring properties were accurately classified as centralized or non-centralized.
A 1.2 pp lift equates to ~3.5 additional occupied units per 300-unit property, which translates to roughly $60k–$75k in incremental annual rental revenue per property, depending on local rent levels.
The results align with industry trends indicating that centralized operating models represent a growing strategic advantage for multifamily operators. While AI helps standardize and accelerate lead nurturing and renewal communications with 24/7 coverage, centralization provides the structural focus and expertise needed to translate that speed into a durable occupancy premium and a more cost-effective staffing model.
In prior work with ALN Apartment Data, EliseAI examined how AI-enabled leasing and resident communication tools perform relative to local market benchmarks. That analysis showed that properties using AI consistently maintained stronger occupancy performance than their surrounding markets, establishing AI as an effective foundation for leasing operations at scale.
As AI adoption has scaled, a new operational question has emerged: once AI increases the volume and velocity of leasing and resident engagement, which operating models are best equipped to convert that activity into sustained performance outcomes?
Traditional onsite staffing models often struggle to keep pace with the cadence and consistency that AI enables, particularly across larger, multi-property portfolios.
This study focuses on that next stage of operations. Using ALN’s independent market benchmarks and a stabilized 2025 cohort of 775 EliseAI properties, we evaluated whether centralized operating models were associated with stronger occupancy performance than non-centralized models within the same AI-enabled customer base.
The occupancy differences observed in this study align with measurable operational differences between centralized and non-centralized teams.
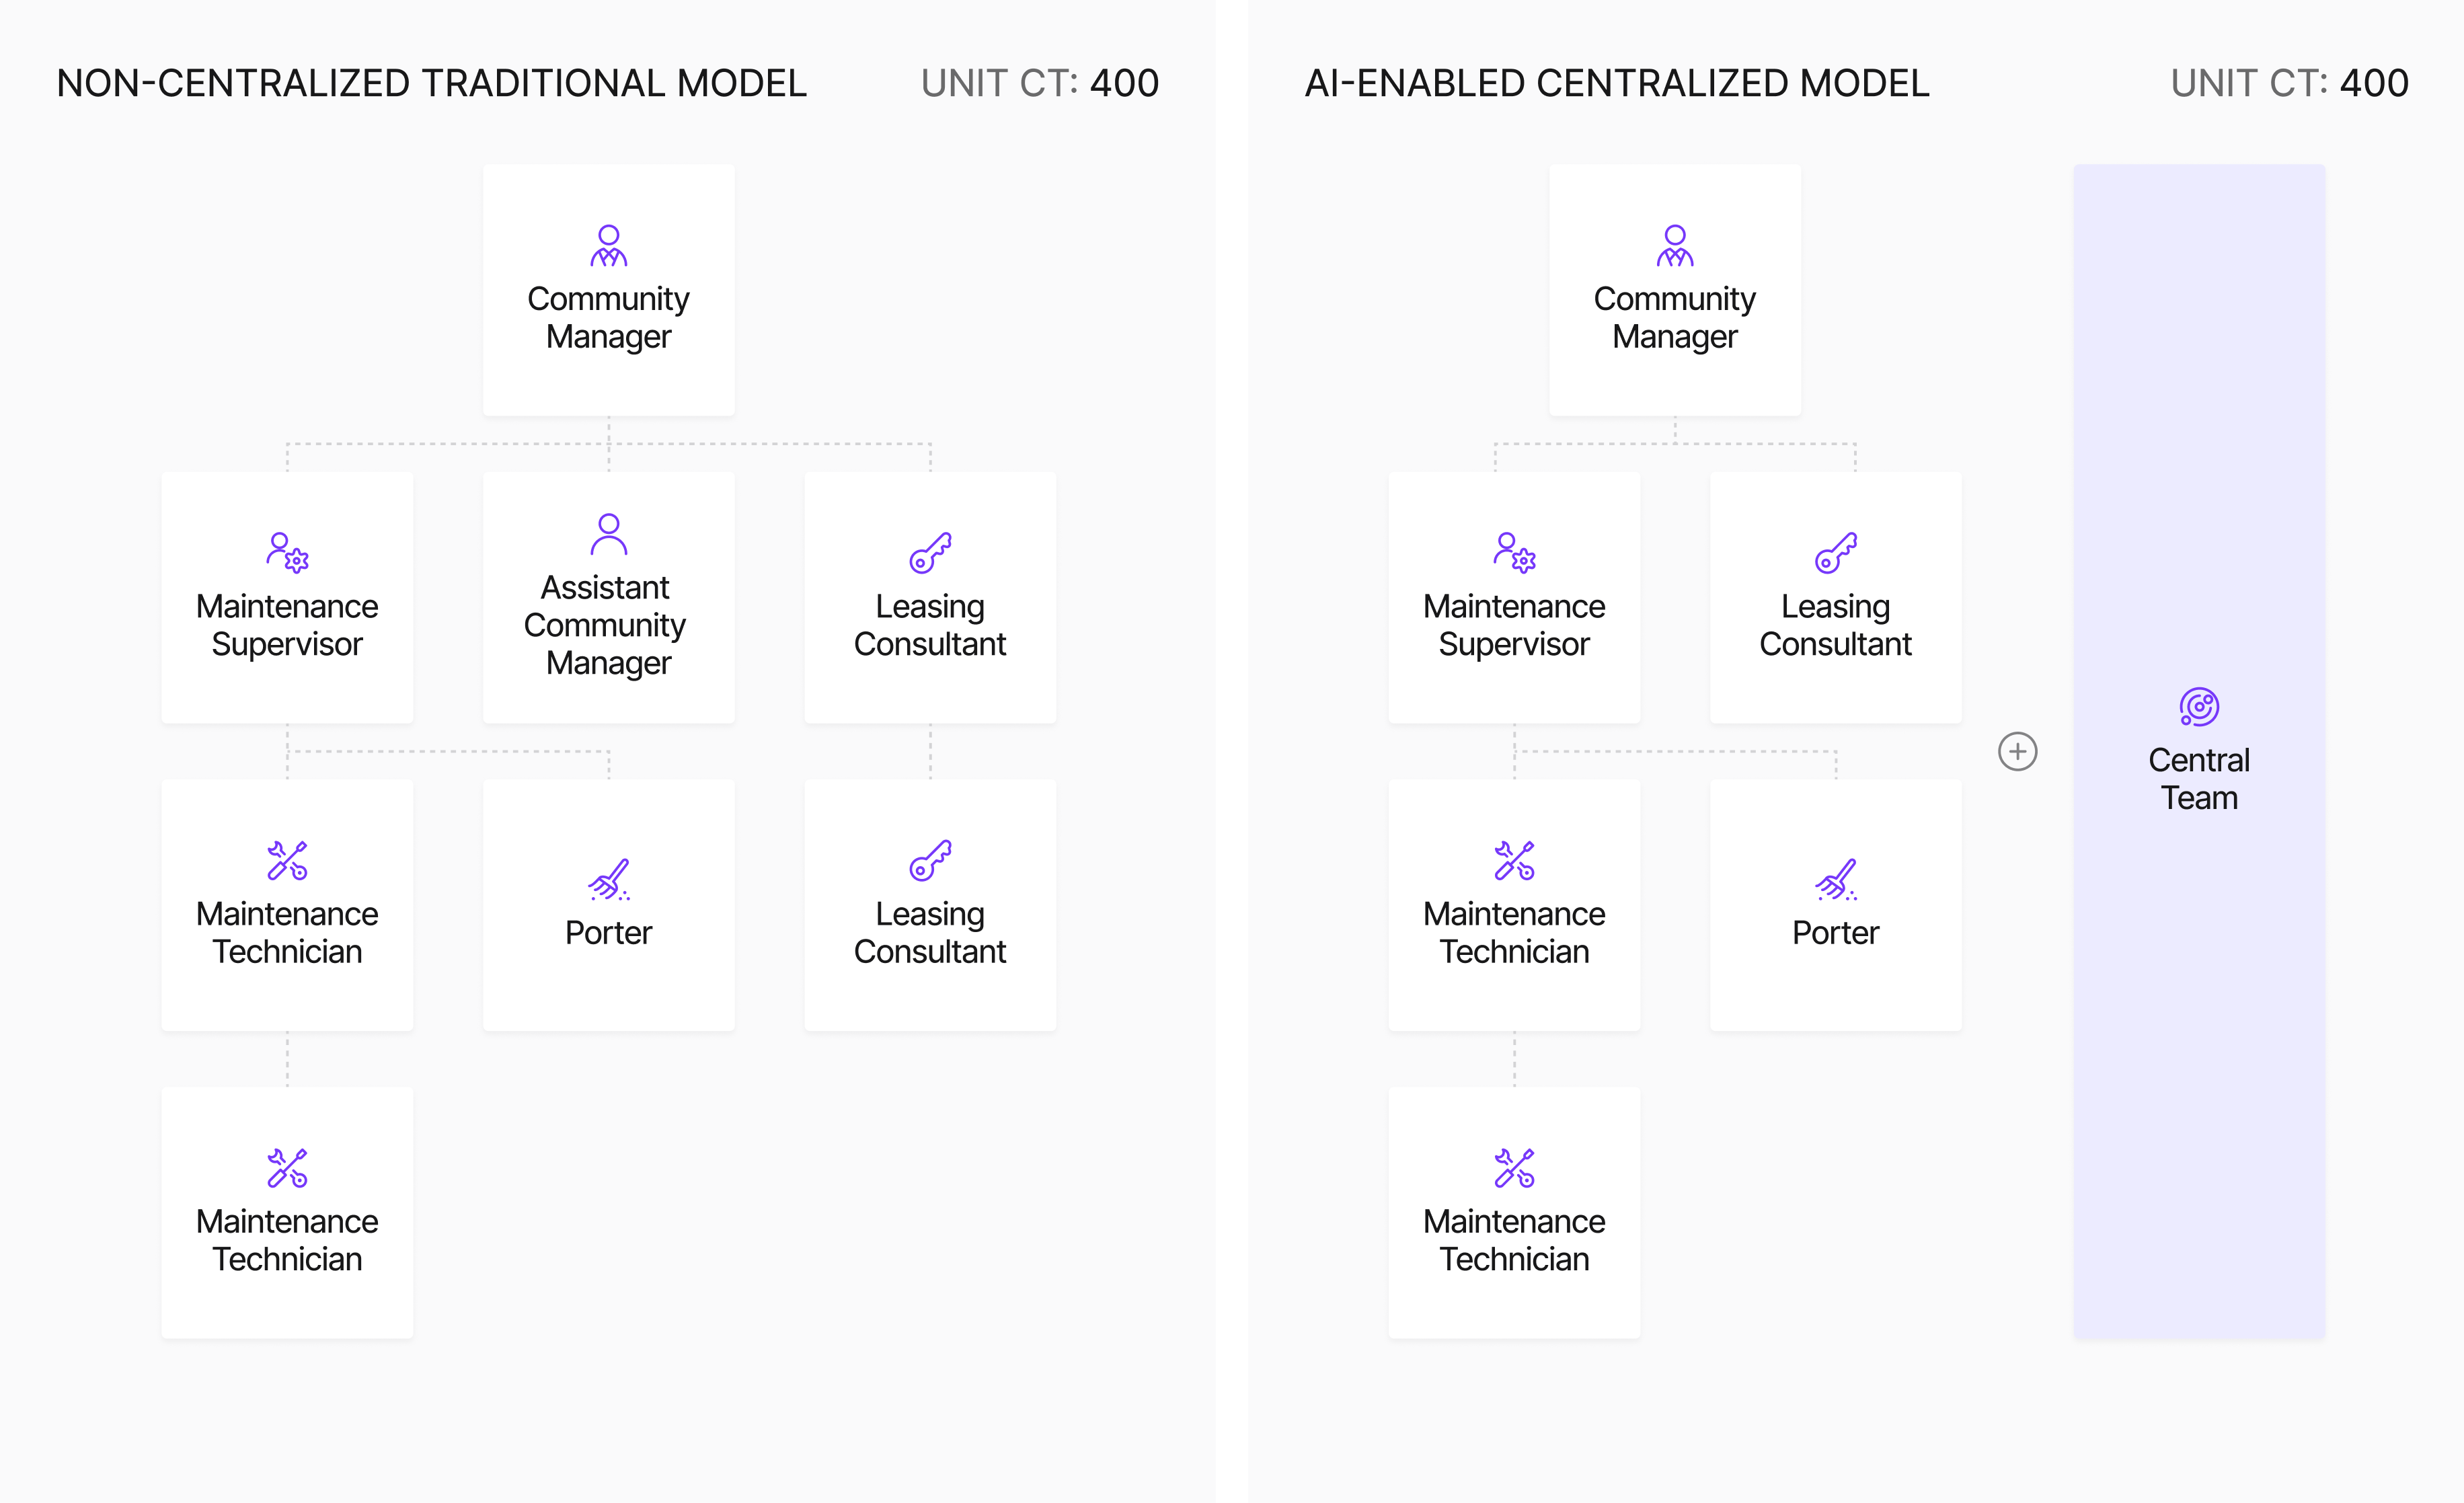
Centralized operating models change how quickly and consistently teams can act on the opportunities surfaced by AI. Rather than balancing leasing, renewals, resident issues, and administrative work onsite, centralized teams operate as specialists with focused skill sets and clearer accountability.
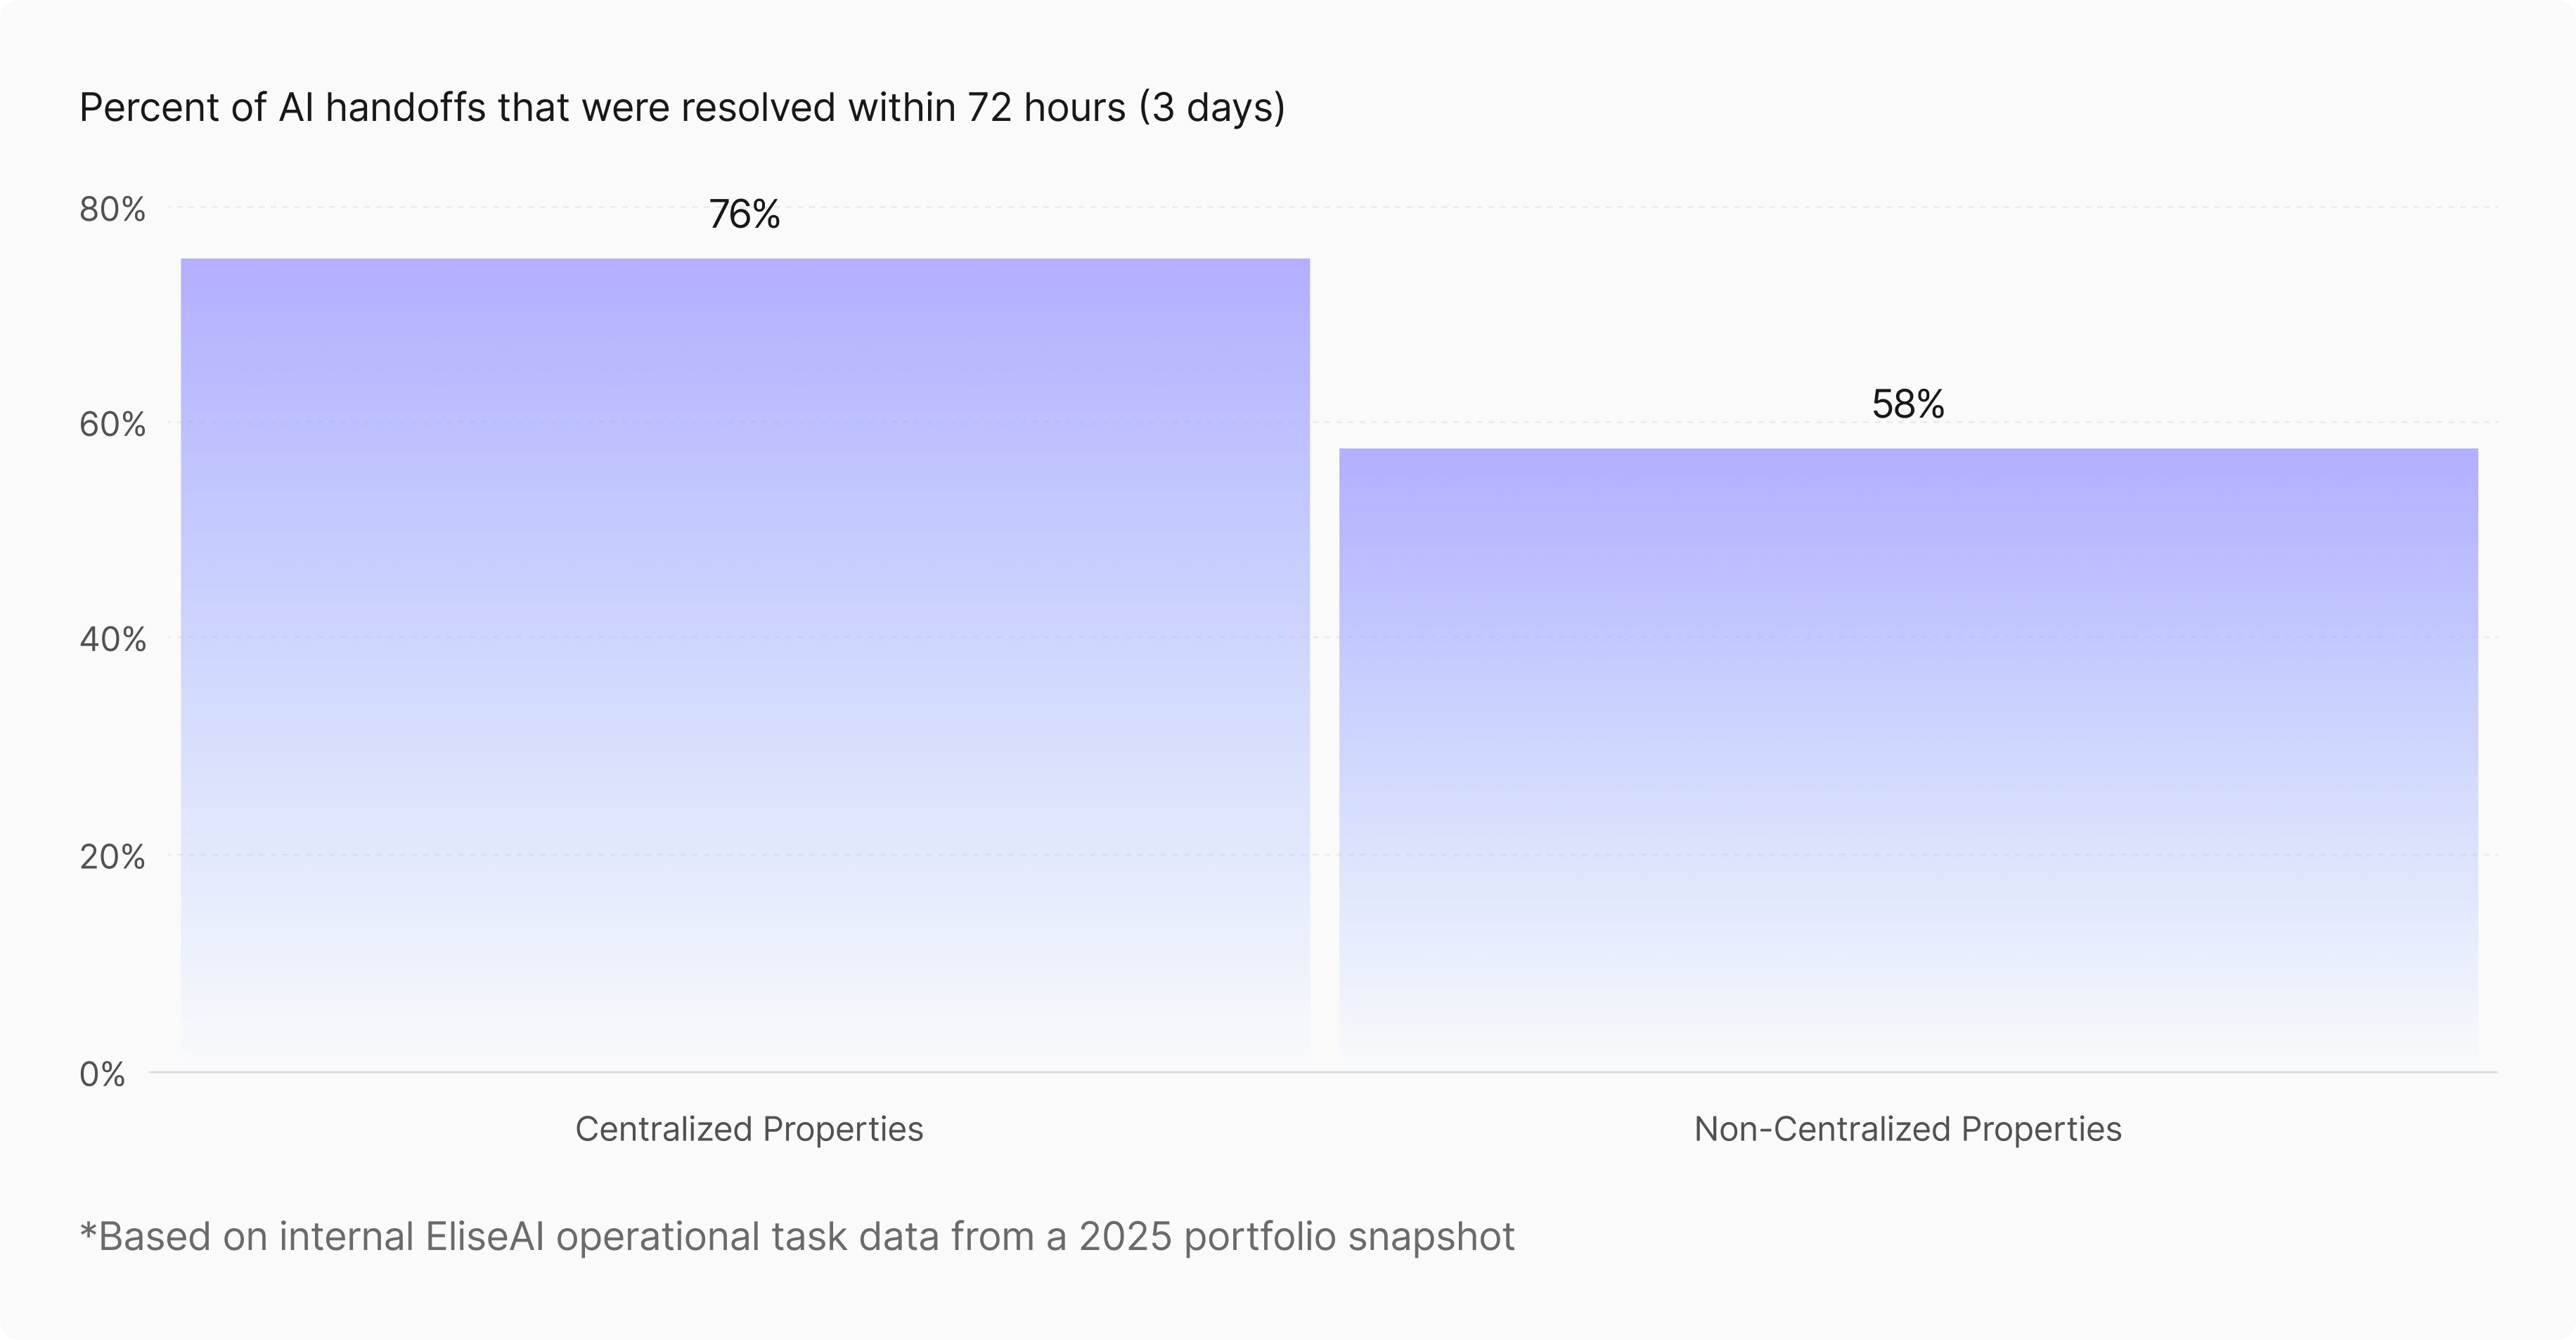
This difference shows up clearly in task follow-through. Across the EliseAI customer base, centralized portfolios resolve approximately 76% of AI handoffs, or situations where the AI product requires human intervention, within 72 hours, compared to 58% in non-centralized portfolios. The gap persists even as customers adopt more EliseAI products, indicating that operating models — not just total technology coverage — play a meaningful role in execution speed and consistency.
Taken together, these patterns are consistent with the occupancy results observed in this study. Faster and more reliable follow-through on AI-identified leasing and renewal opportunities is well aligned with stronger lease conversion and resident retention, particularly in speed- and service-sensitive environments.
These findings suggest that embedding AI into core leasing and resident service workflows — and redesigning the workforce through centralization — is associated with greater operational speed and consistency. As AI changes the volume and cadence of work across portfolios, operating model design plays an increasingly important role in how effectively that work is executed.
In today’s operating environment, legacy onsite-centric models are increasingly misaligned with the speed and specialization that AI-enabled workflows introduce. The performance differences observed in this study indicate that operating structure — not just technology — shapes how AI translates into results.
At the same time, transitioning to a centralized model is a non-trivial organizational change. Operators that successfully make this shift typically ensure:
For organizations deploying AI at scale, pairing that technology with deliberate workforce and operating model design is increasingly critical to realizing its full potential.
Monthly property-level occupancy and market occupancy from ALN, joined to EliseAI data on product adoption and centralization status.
Stabilized, conventional properties with 50+ units, stabilized before early 2025, and excluding collections-only assets. This yields 775 properties across 32 operators and 35 states.
A property is treated as centralized beginning in the first full calendar month in which a centralized team consistently handles a meaningful share of its leasing, renewal, or resident service tasks, as reflected in task and user activity data. Centralization is defined at the property level based on observed operational behavior rather than stated intent.
For each property–month we compute:
- Diff = Property occupancy − ALN market occupancy (percentage points).
We run a weighted regression of Diff on Centralized Month, controlling for market, ALN class, month, and state. Each property is given equal total weight, and we use robust standard errors.
Centralized properties are associated with approximately +1.2 percentage point higher occupancy rates than non-centralized peers after controlling for market, asset class, and geography.
The study analyzes a stabilized 2025 panel of 775 properties (230,000+ units) across 32 operators ranging from 3k to 100k+ units and spanning 35 states.
Centralization status was validated through a combination of qualitative review and internal product usage data, ensuring properties were accurately classified as centralized or non-centralized.
A 1.2 pp lift equates to ~3.5 additional occupied units per 300-unit property, which translates to roughly $60k–$75k in incremental annual rental revenue per property, depending on local rent levels.
The results align with industry trends indicating that centralized operating models represent a growing strategic advantage for multifamily operators. While AI helps standardize and accelerate lead nurturing and renewal communications with 24/7 coverage, centralization provides the structural focus and expertise needed to translate that speed into a durable occupancy premium and a more cost-effective staffing model.
In prior work with ALN Apartment Data, EliseAI examined how AI-enabled leasing and resident communication tools perform relative to local market benchmarks. That analysis showed that properties using AI consistently maintained stronger occupancy performance than their surrounding markets, establishing AI as an effective foundation for leasing operations at scale.
As AI adoption has scaled, a new operational question has emerged: once AI increases the volume and velocity of leasing and resident engagement, which operating models are best equipped to convert that activity into sustained performance outcomes?
Traditional onsite staffing models often struggle to keep pace with the cadence and consistency that AI enables, particularly across larger, multi-property portfolios.
This study focuses on that next stage of operations. Using ALN’s independent market benchmarks and a stabilized 2025 cohort of 775 EliseAI properties, we evaluated whether centralized operating models were associated with stronger occupancy performance than non-centralized models within the same AI-enabled customer base.
The occupancy differences observed in this study align with measurable operational differences between centralized and non-centralized teams.
Centralized operating models change how quickly and consistently teams can act on the opportunities surfaced by AI. Rather than balancing leasing, renewals, resident issues, and administrative work onsite, centralized teams operate as specialists with focused skill sets and clearer accountability.
This difference shows up clearly in task follow-through. Across the EliseAI customer base, centralized portfolios resolve approximately 76% of AI handoffs, or situations where the AI product requires human intervention, within 72 hours, compared to 58% in non-centralized portfolios. The gap persists even as customers adopt more EliseAI products, indicating that operating models — not just total technology coverage — play a meaningful role in execution speed and consistency.
Taken together, these patterns are consistent with the occupancy results observed in this study. Faster and more reliable follow-through on AI-identified leasing and renewal opportunities is well aligned with stronger lease conversion and resident retention, particularly in speed- and service-sensitive environments.
These findings suggest that embedding AI into core leasing and resident service workflows — and redesigning the workforce through centralization — is associated with greater operational speed and consistency. As AI changes the volume and cadence of work across portfolios, operating model design plays an increasingly important role in how effectively that work is executed.
In today’s operating environment, legacy onsite-centric models are increasingly misaligned with the speed and specialization that AI-enabled workflows introduce. The performance differences observed in this study indicate that operating structure — not just technology — shapes how AI translates into results.
At the same time, transitioning to a centralized model is a non-trivial organizational change. Operators that successfully make this shift typically ensure:
For organizations deploying AI at scale, pairing that technology with deliberate workforce and operating model design is increasingly critical to realizing its full potential.
Monthly property-level occupancy and market occupancy from ALN, joined to EliseAI data on product adoption and centralization status.
Stabilized, conventional properties with 50+ units, stabilized before early 2025, and excluding collections-only assets. This yields 775 properties across 32 operators and 35 states.
A property is treated as centralized beginning in the first full calendar month in which a centralized team consistently handles a meaningful share of its leasing, renewal, or resident service tasks, as reflected in task and user activity data. Centralization is defined at the property level based on observed operational behavior rather than stated intent.
For each property–month we compute:
- Diff = Property occupancy − ALN market occupancy (percentage points).
We run a weighted regression of Diff on Centralized Month, controlling for market, ALN class, month, and state. Each property is given equal total weight, and we use robust standard errors.


